Network Visualization
Software
Gephi is the software used for the visualization of network. It will help us to reveal patterns in the network that is created using the data set.
Data
The data-set being used is Les Miserables which is a coappearance weighted network of characters in the novel Les Miserables. The Network is in .gexf file format. It holds data about the link between two characters that appeared on the same page or paragraph in the Novel.
It consists of 74 nodes and 248 edges,i.e, 74 characters linked by 248 links. The graph is undirected.
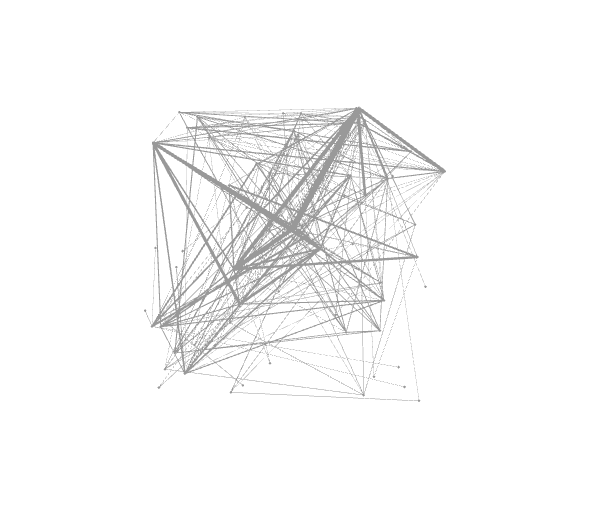
Initial Overview
The network is initally loaded as below in Gephi, it needs a lot of processing to understand/retrive any information from it which is explained ahead.
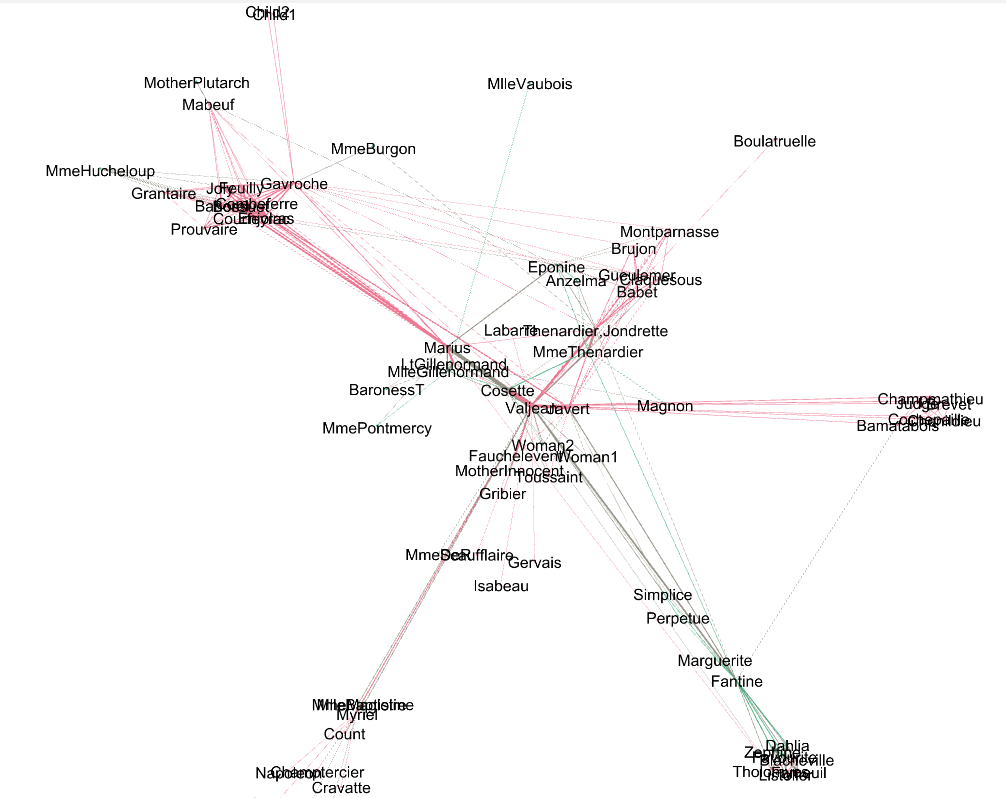
Processing the Network
We change the layout to force atlas 2, it helps in bring nodes which are connected together therefore helping us detect community of nodes. The pink color is of male character and green is for female characters that are on the same page in the book.
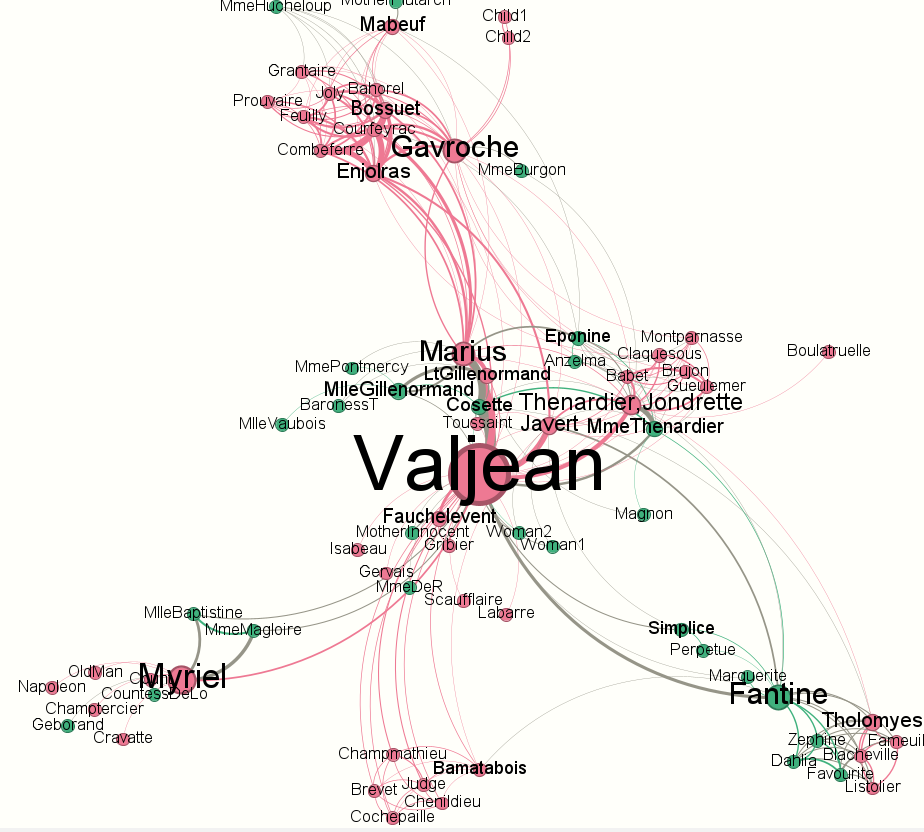
Final Network
After making changes in the Preview panel we obtain a network as shown below. We can now easily see different clusters of characters which are together on the same page.
References